Use poisson distribution to generate random discrete events over a time for simulation
05 Feb 2020
Reading time ~3 minutes
Poisson distribution:
the probabily mass function of discrete random variable \(X\) having a poisson distribution:
\(f(k;\lambda) = \Pr(X = k) = \frac{\lambda^{k}e^{-\lambda}}{k!}\)
where \(e\) is Euler’s number, \(k = 0,1,2,...\) , \(\lambda > 0\). and \(\lambda = E(X) = Var(X)\).
Some key notes:
- k is the number of occurence of events occured in an interval, k is 0,1,2…
- the events are all independent, the occurence of one event will not affect the probability of another event occur
- Two events will not occur at the same time.
Understanding implementation in Discrete Events Simulation:
For Discrete Events Simulations, as we would like to randomly generate discrete and independent events, poisson is a very good fit.
For example, I want to simulate a car flow, to see at certain traffic flow rate (how many cars can pass in an unit time), how the traffic will be. Before we getting to any queue model or other simulation models, we need to fisrt generate some timestamps for each car’s arrival time. Poisson distribution can help on this step!
We could derive the \(\lambda\) from this traffic flow rate. E.g. 500 car per hour. which is about 0.137 car per second.
And poisson distribution will gave us the probability distribution of \(k = 0,1,2 ...\) events happening in each time interval that for this \(\lambda\). This is exactly what we want to generate the events happening.
I write this function with numpy package for the implementation:
import os

import numpy as np
import matplotlib
import matplotlib.pyplot as plt
rng_seed = 8
n_list = [500, 50000, 5000000]
t = 1 #hr

class Scene:
    def __init__(self,n,t,rng_seed):
        self.N = n
        self.T = t
        self.rng_seed = rng_seed
    def poisson_generate_timestamps(self):
            lamda = float(self.N)/float(self.T)/60.0/60.0 #lambda per second
            Time = int(self.T*60.0*60.0) #total seonds
            np.random.seed(self.rng_seed)# initialize generator with seed
            poisson = np.random.poisson(lamda,Time)# generated the poisson events over the total time interval(s)
            time_stamps = []
            time_stamp = 0.0
            for k in poisson:# for each second, could have k = 0,1,2.... k from our generated poisson values
                if k != 0:
                    event_time = np.random.uniform(0,1.0,k)#if k not zero, k could be more than 1, we could generate uniform random number within 1s for all k
                    for t_s in event_time:
                        time_stamp=time_stamp+t_s
                        time_stamps.append(time_stamp)
                else:
                    time_stamp = time_stamp+1.0#if k is zero within 1 second, simply pass this and add 1 s to for time increase
            np.sort(time_stamps)#sort the timestamps
            total_sim_event = len(time_stamps)
            sim_mean = np.mean(poisson)
            sim_var = np.var(poisson)
            print('\nBased on input parameters [{} events , {} hr], expected rate is {:.3f} events/second, \nSampled {} events based on poisson process within time {} hr,sample mean is {:.3f} events/second, sample var is {: .3f}'\
                .format(self.N,self.T,lamda,total_sim_event,self.T,sim_mean,sim_var))
            return time_stamps,poisson

def save_poisson_hist_plot(poisson,name):
    print("saving ... {} plot ... ".format(name))
    dirpath = os.path.dirname(os.path.realpath(__file__))
    res_dir = results_dir = os.path.join(dirpath, 'outputs/')
    if not os.path.isdir(res_dir):
        os.makedirs(res_dir)
    fig, ax = plt.subplots()
    plt.title(name)
    plt.ylabel('count')
    plt.xlabel('bins')
    bin_num = (max(poisson)-min(poisson))*4
    n, bins, patches = plt.hist(poisson,bin_num, facecolor='b', alpha=0.75)
    plt.savefig(res_dir+name+'.png',dpi=600)
    return

for n in n_list:
    scene = Scene(n,t,11)
    timestamps, poisson = scene.poisson_generate_timestamps()
    name = str(n)+'_plot'
    save_poisson_hist_plot(poisson, name)
And the outputs are:
Based on input parameters [500 events , 1 hr], expected rate is 0.139 events/second,
Sampled 510 events based on poisson process within time 1 hr,sample mean is 0.142 events/second, sample var is  0.142
saving ... 500_plot plot ...

Based on input parameters [50000 events , 1 hr], expected rate is 13.889 events/second,
Sampled 50101 events based on poisson process within time 1 hr,sample mean is 13.917 events/second, sample var is  13.500
saving ... 50000_plot plot ...

Based on input parameters [5000000 events , 1 hr], expected rate is 1388.889 events/second,
Sampled 5000949 events based on poisson process within time 1 hr,sample mean is 1389.152 events/second, sample var is  1337.519
saving ... 5000000_plot plot ...
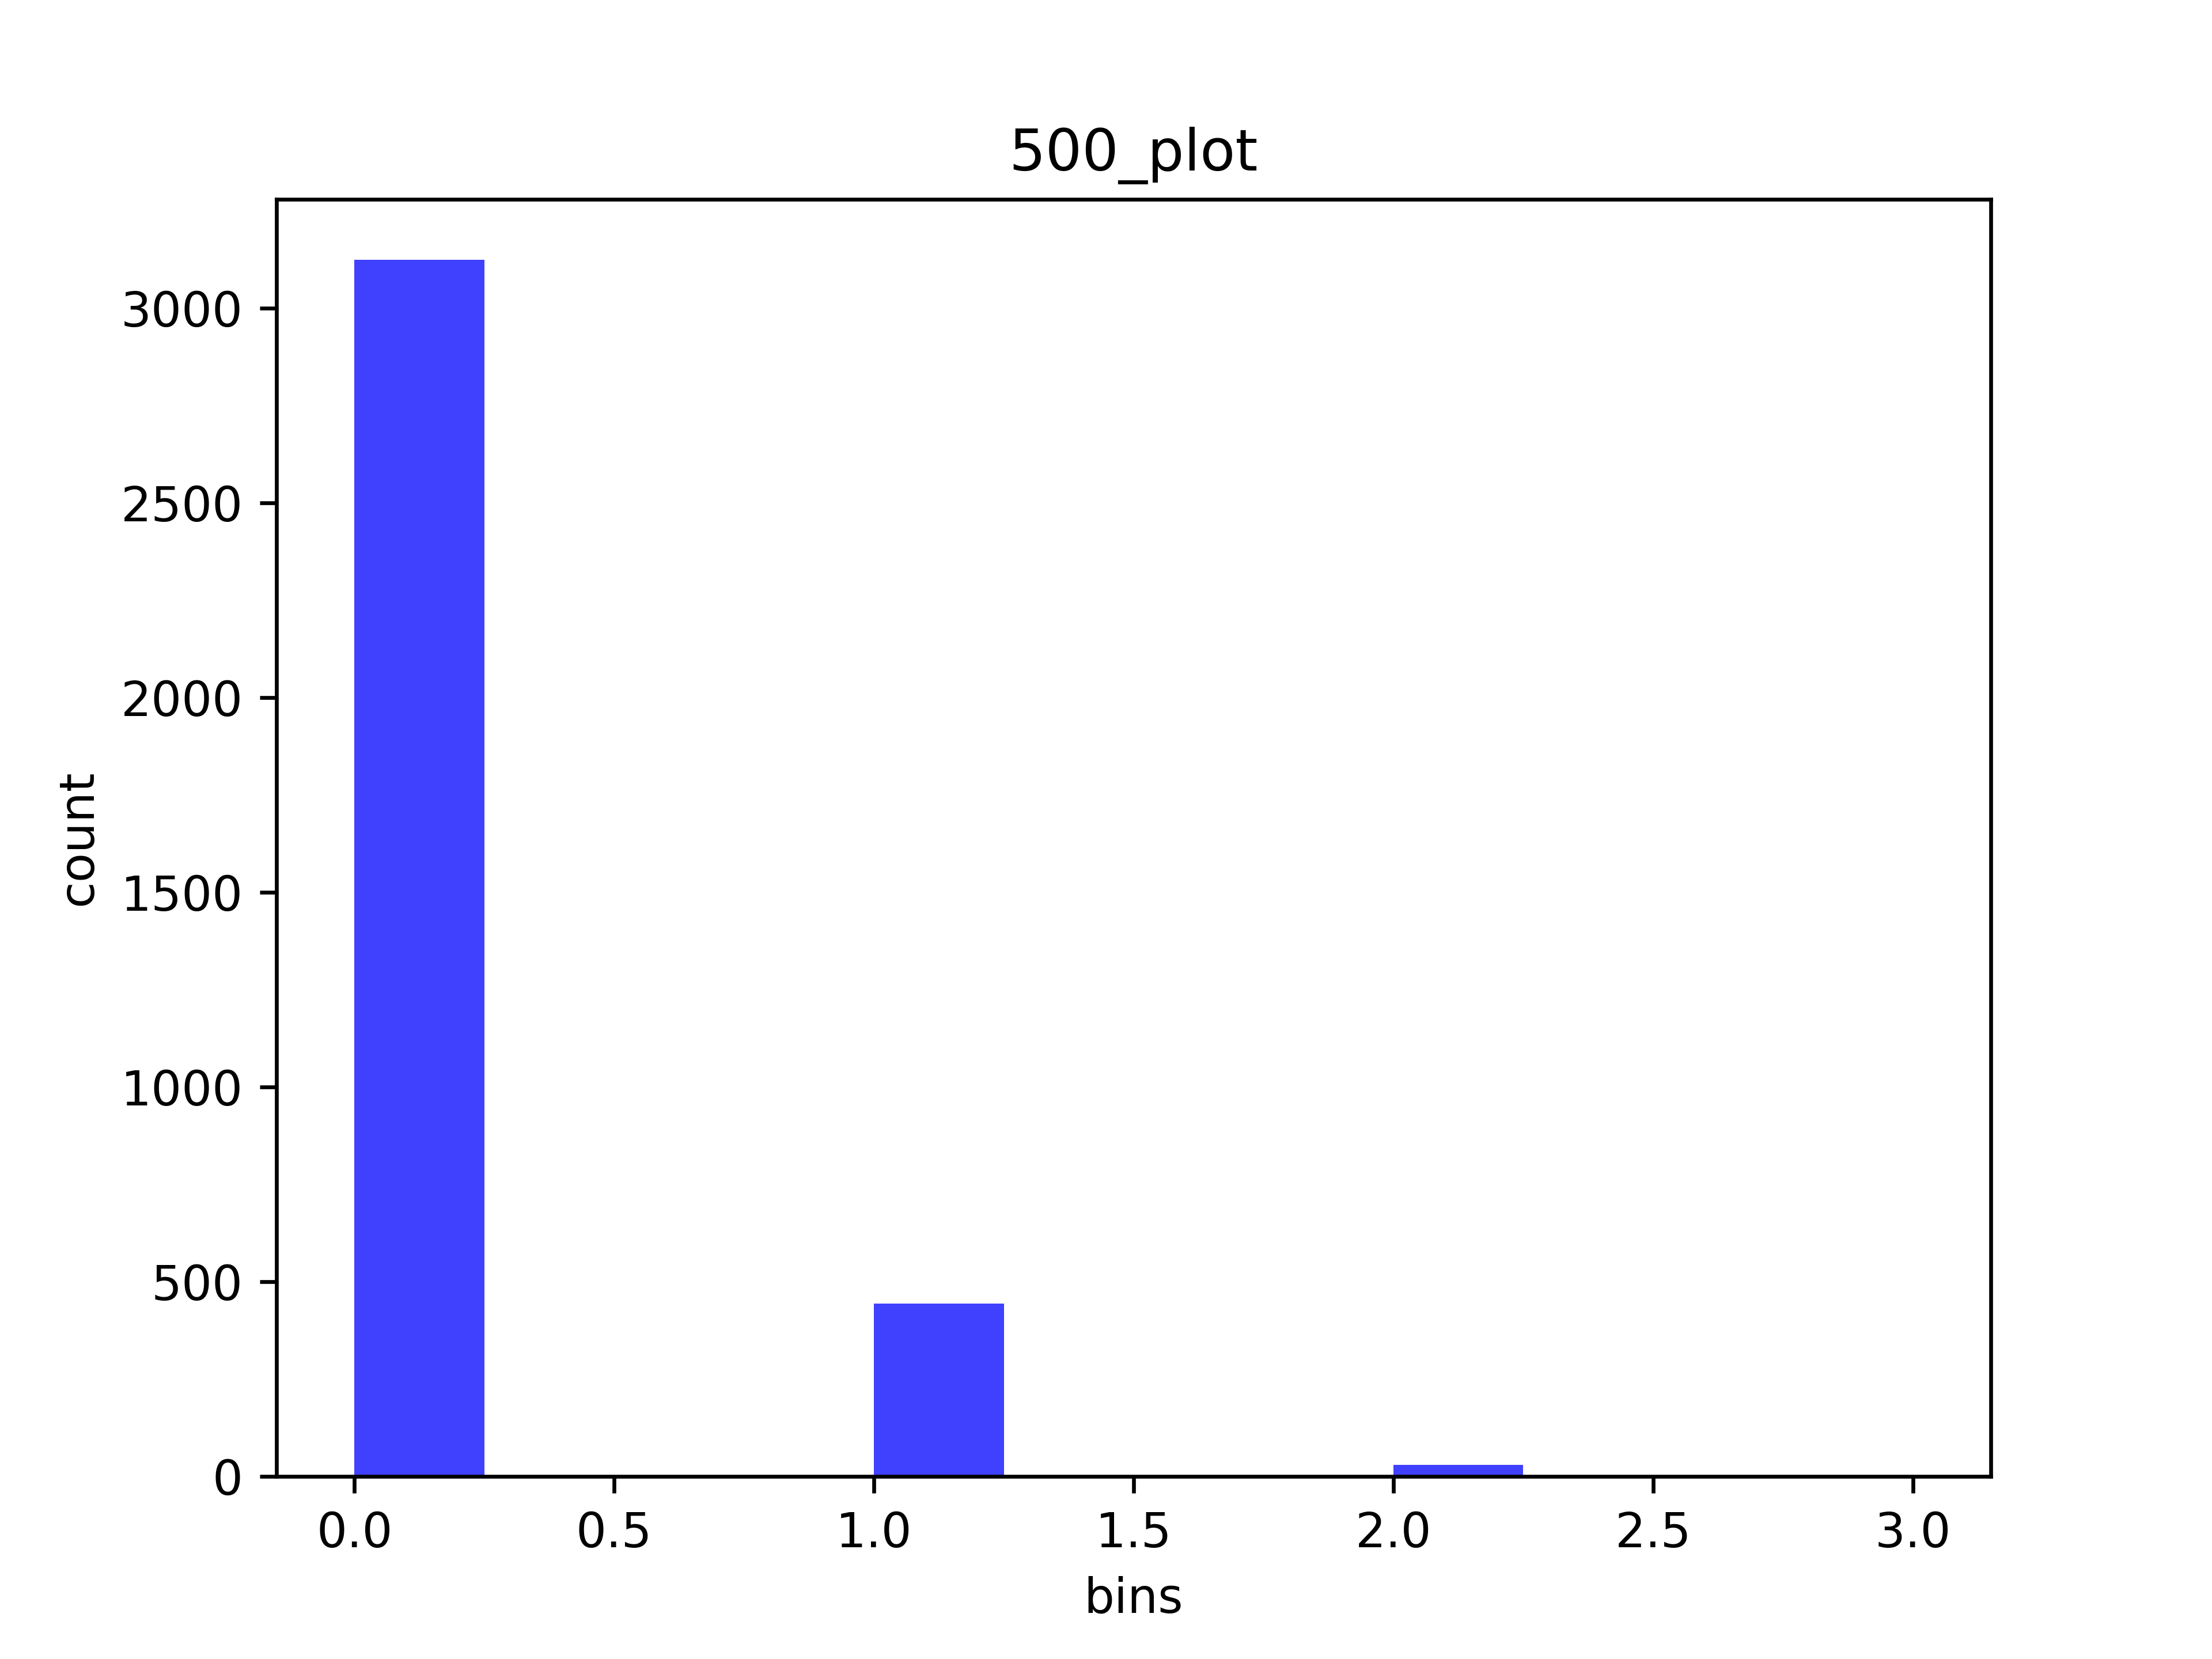
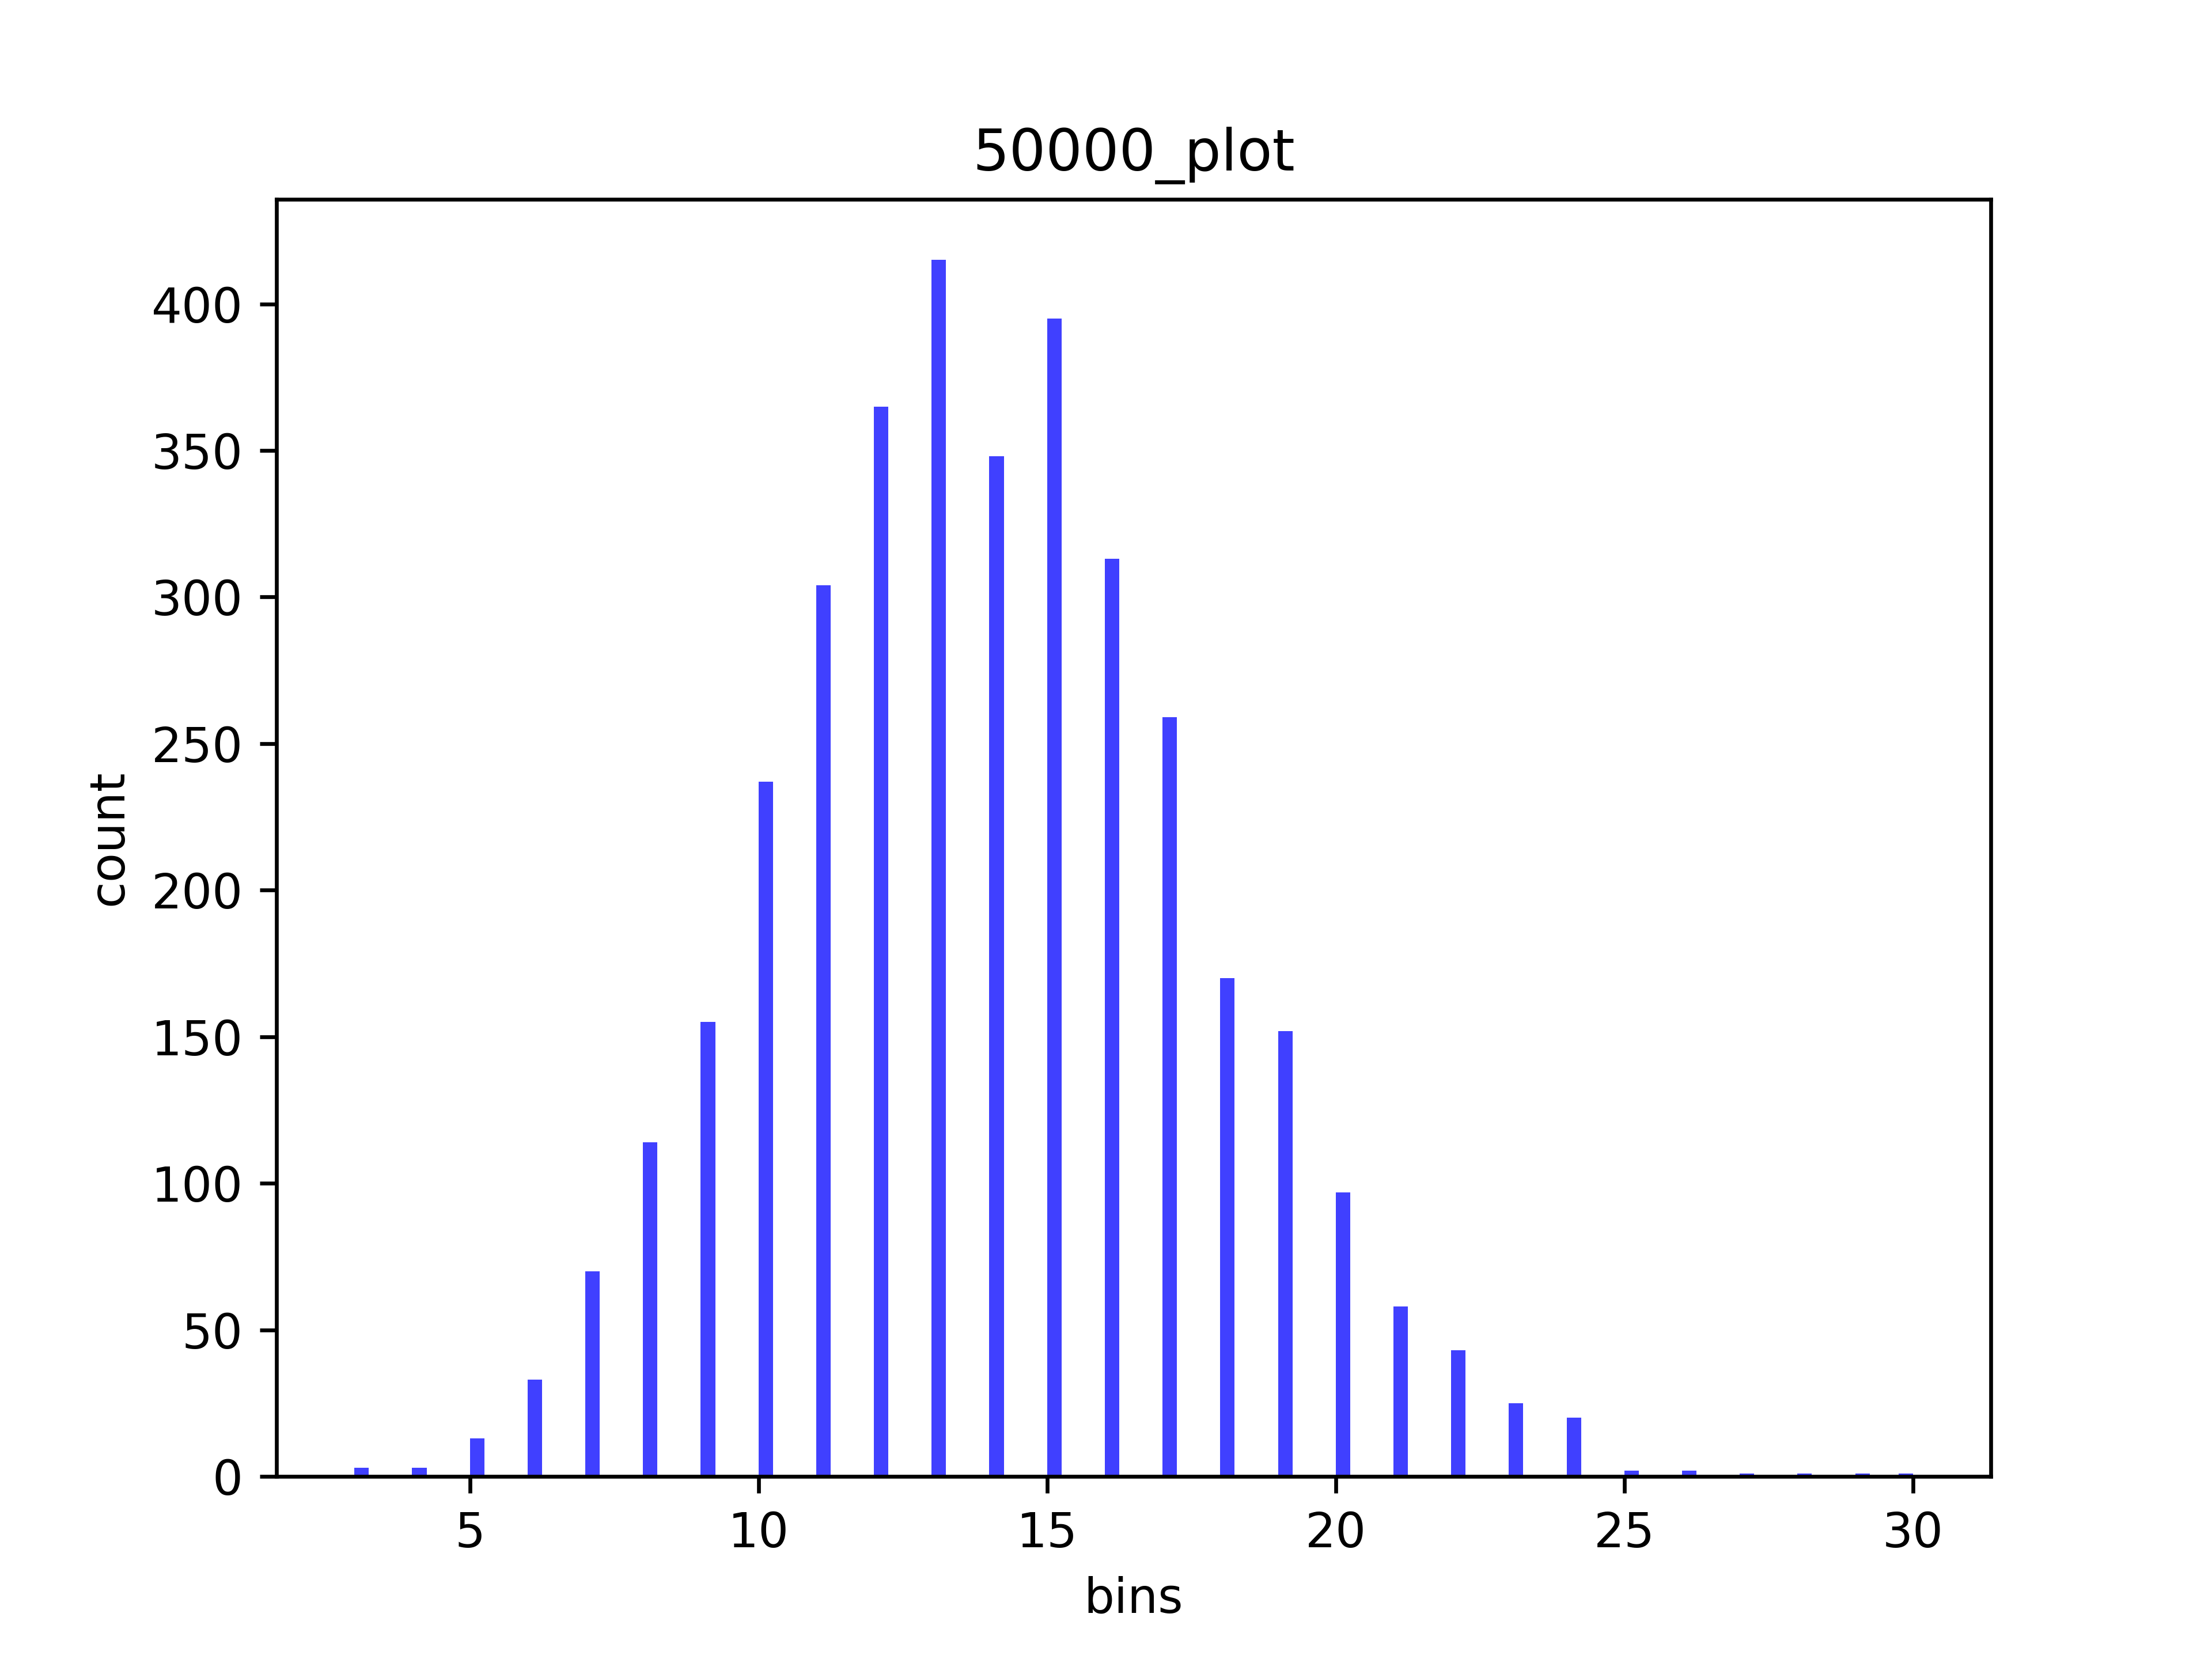
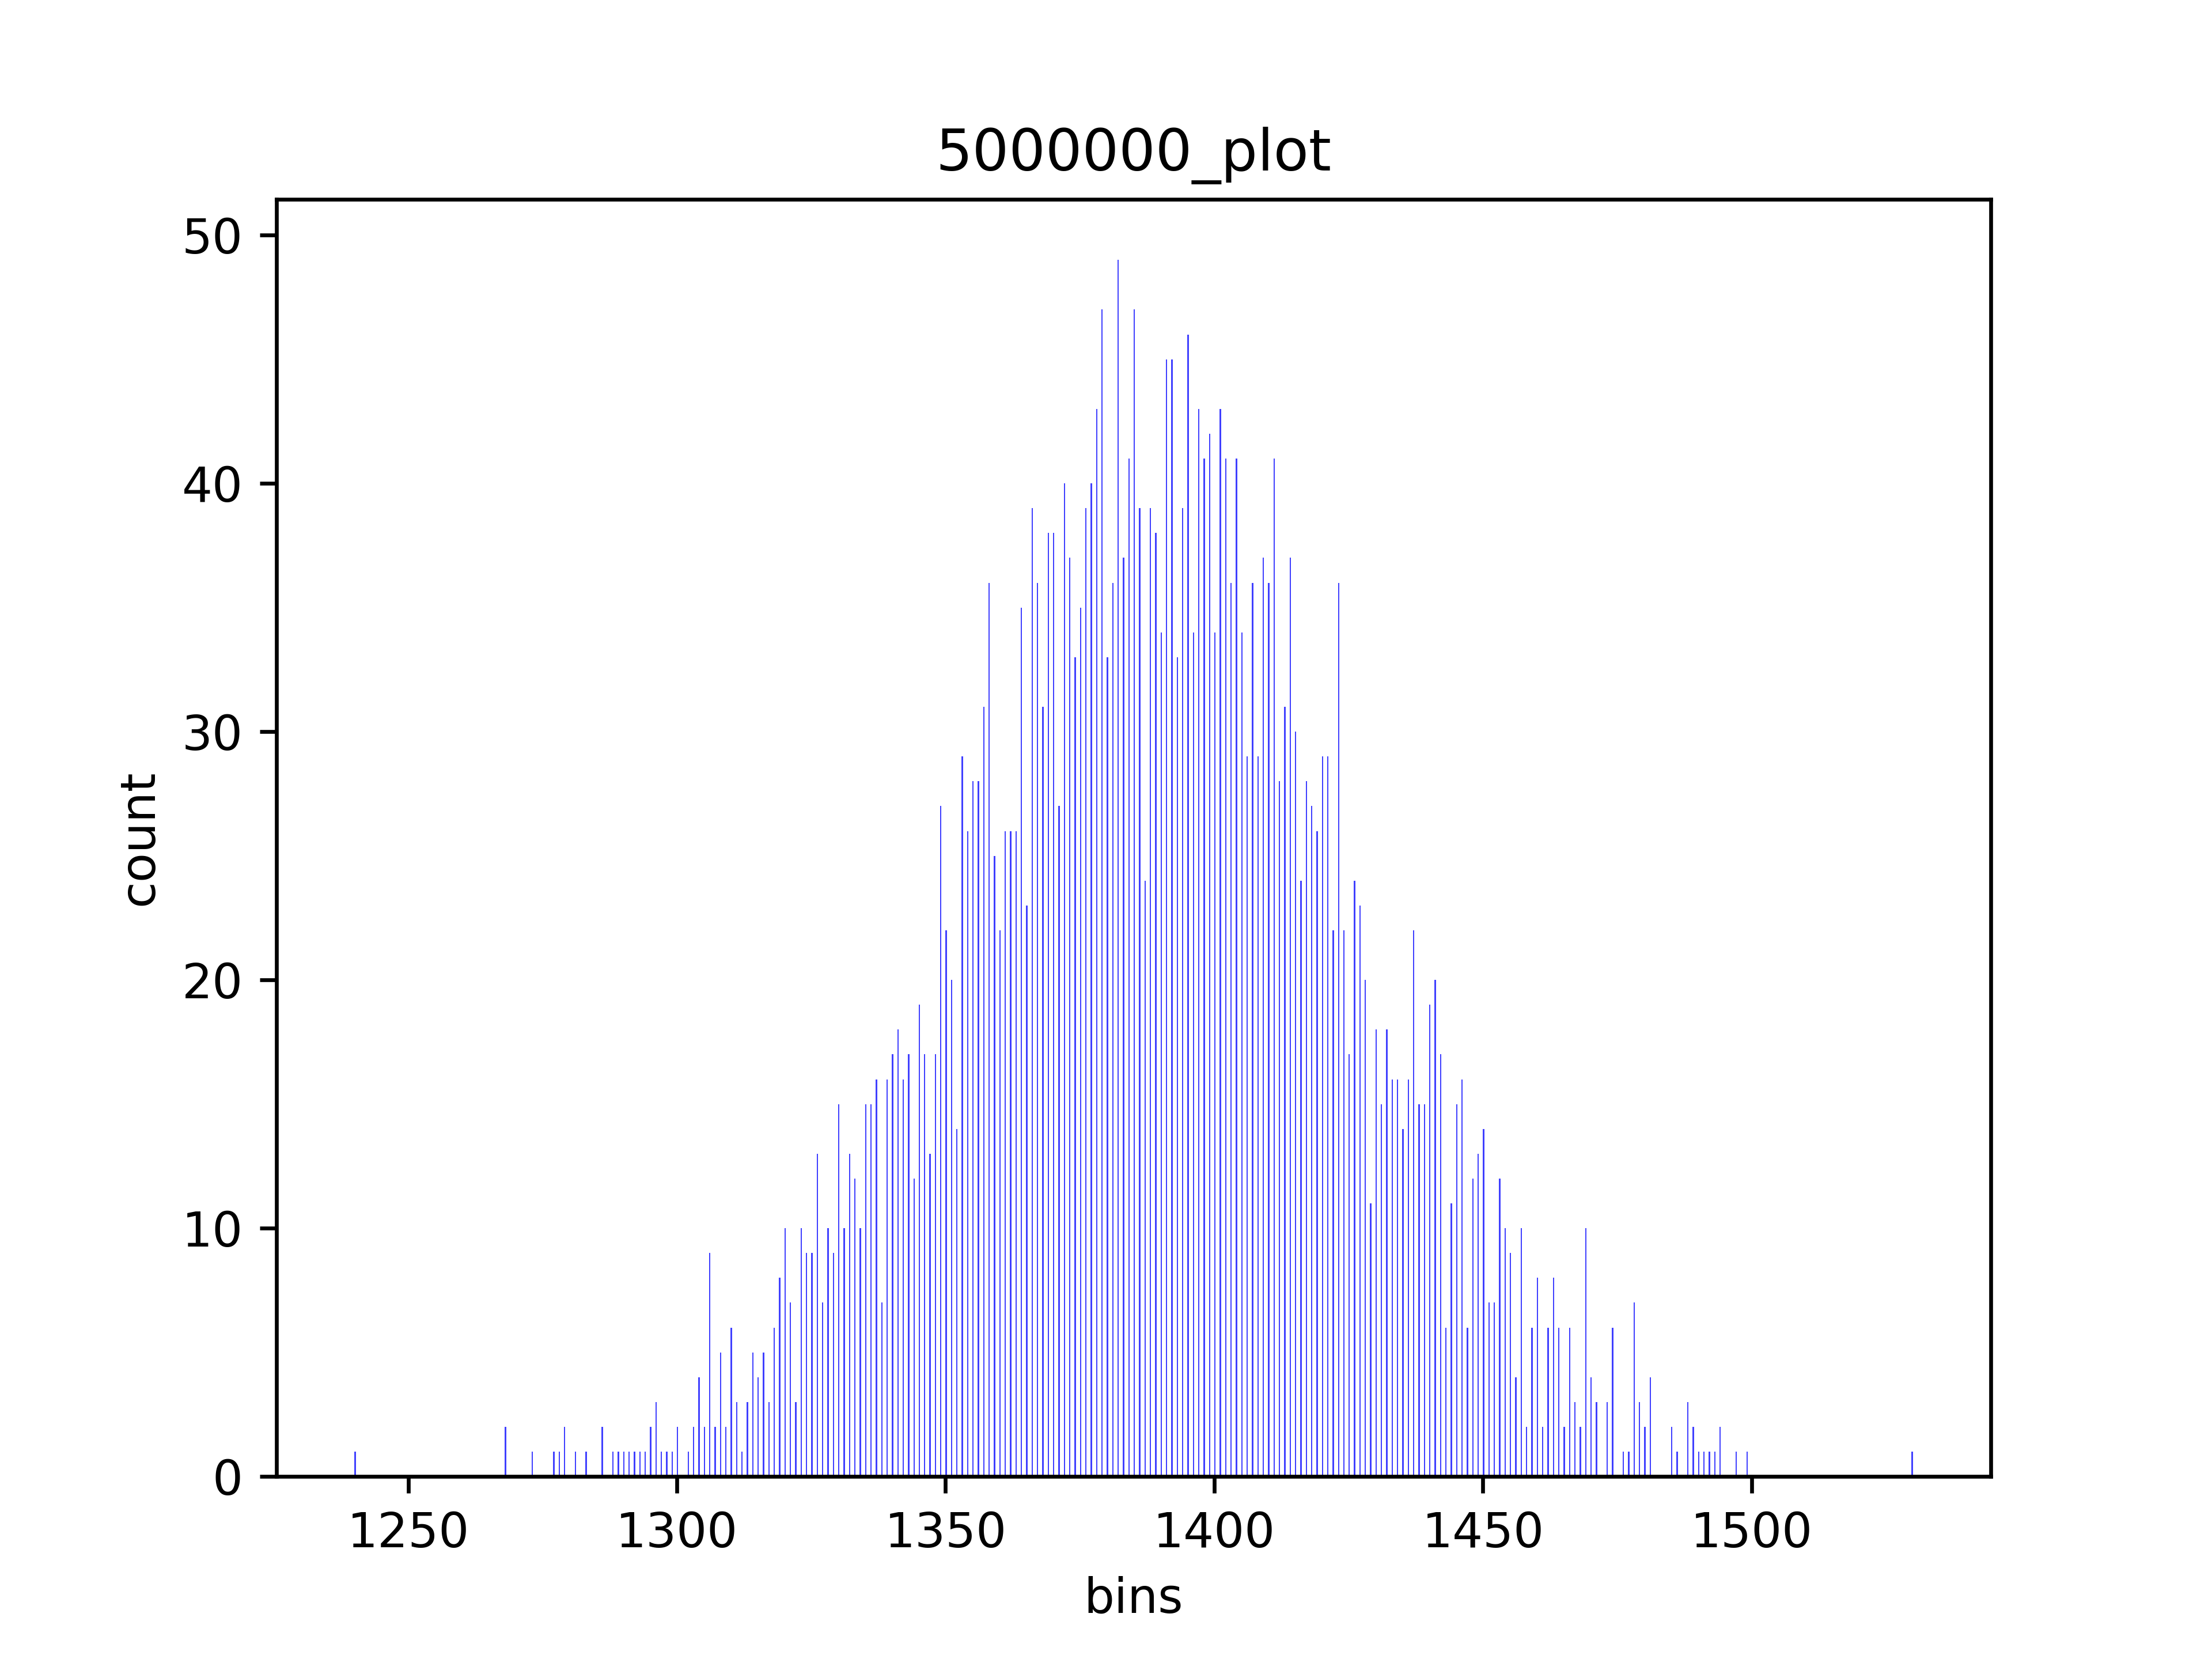
As can be seen from these histograms, as N increases,while t stays the same, thus \(\lambda\) is increasing, the distribution is more close to normal, but probability of K is actually lower (compare the count over the N). Just like the probabilily distribution cited from the wikipedia page here:

And our program validated that the generated events mean and variance are very close to our expectation \(\lambda\).
In this way we can generate random discrete events using poisson distribution.
Copyright 2019 Muyang Guo